

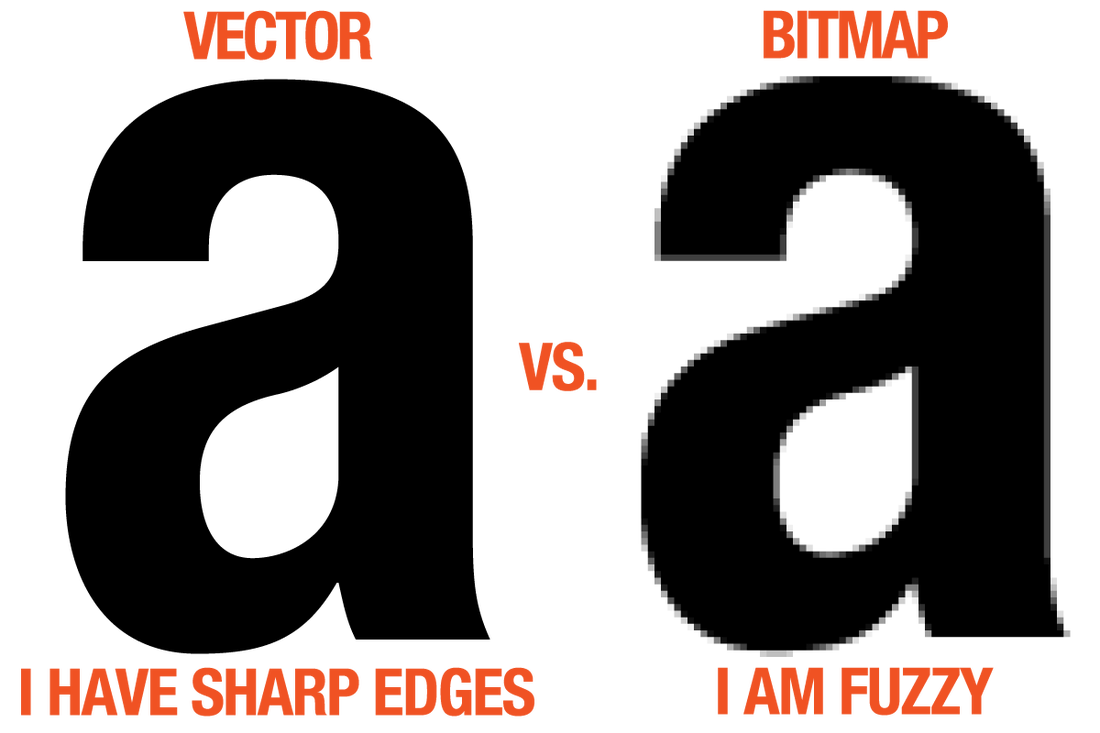
GRAPHICS + VECTORS
INFOGRAPHICS
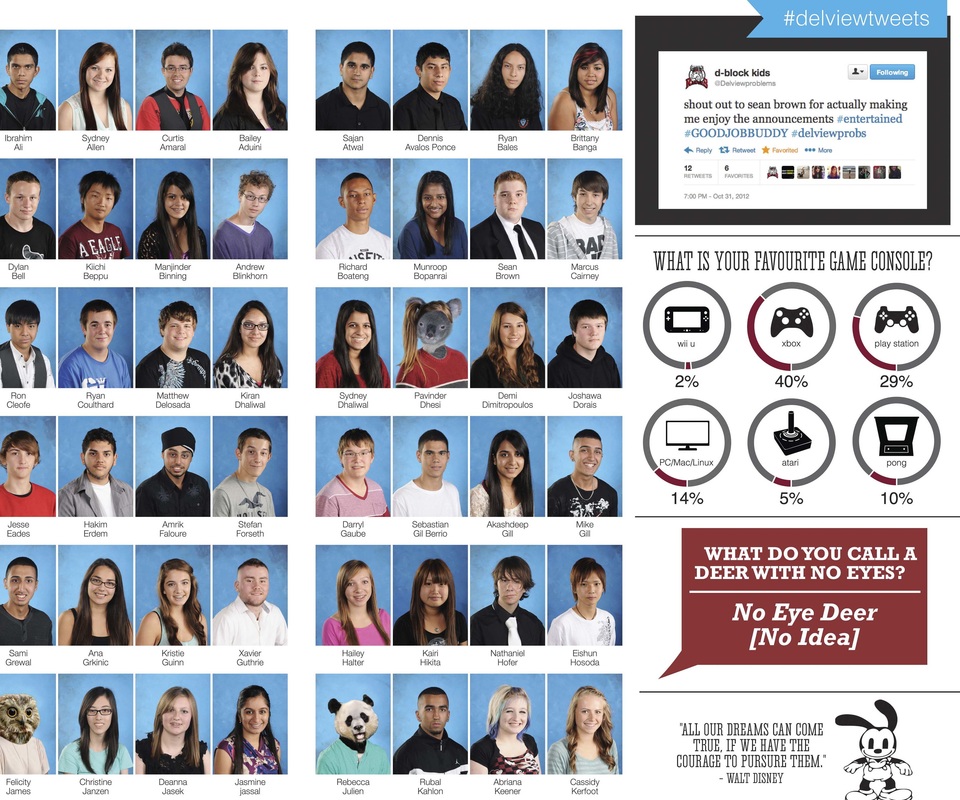
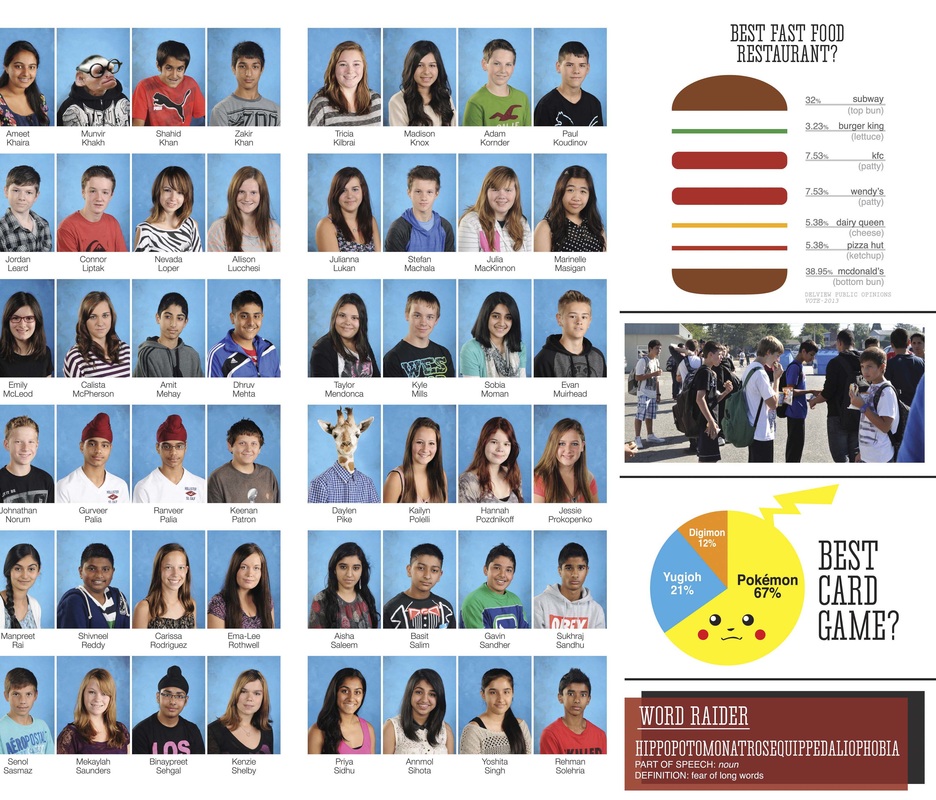
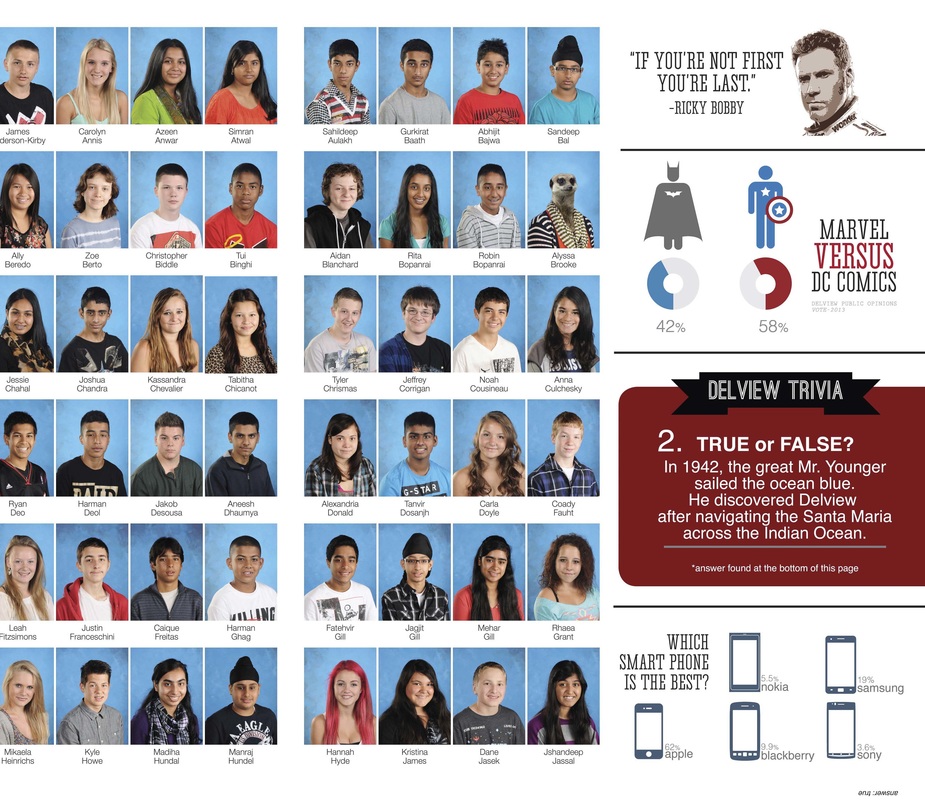
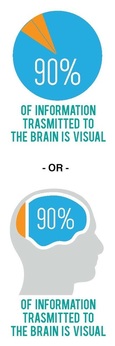
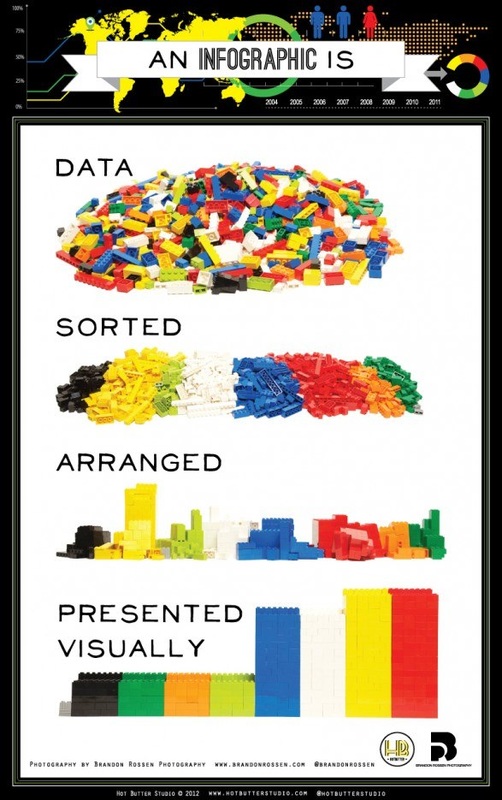
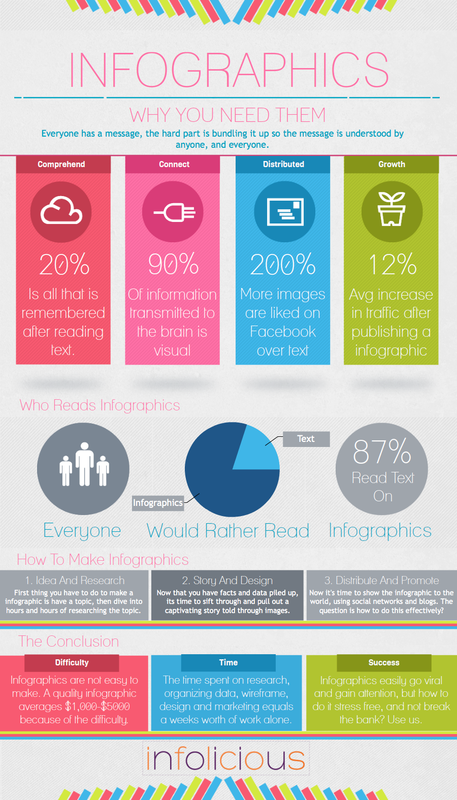
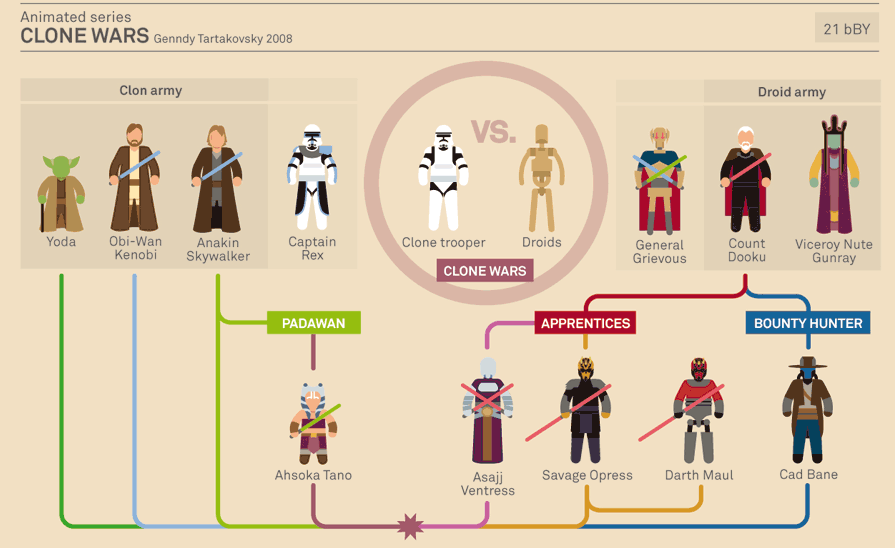
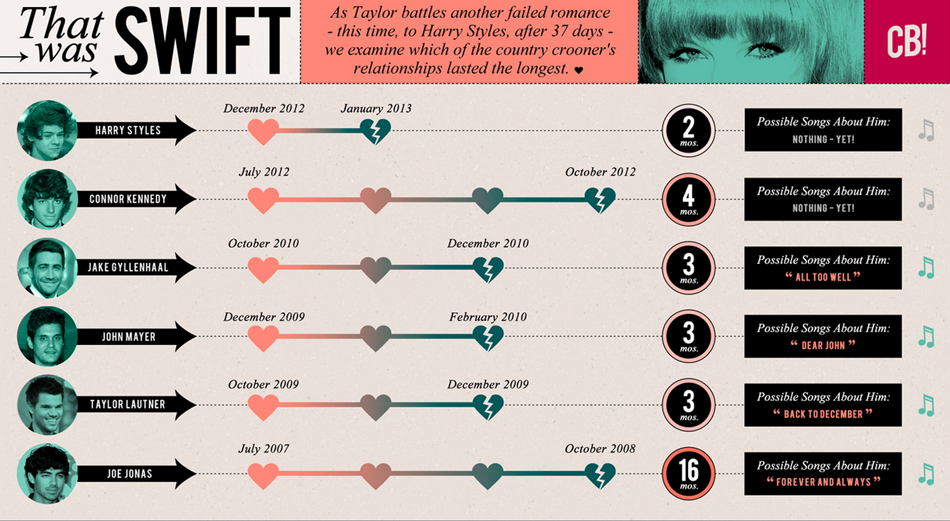
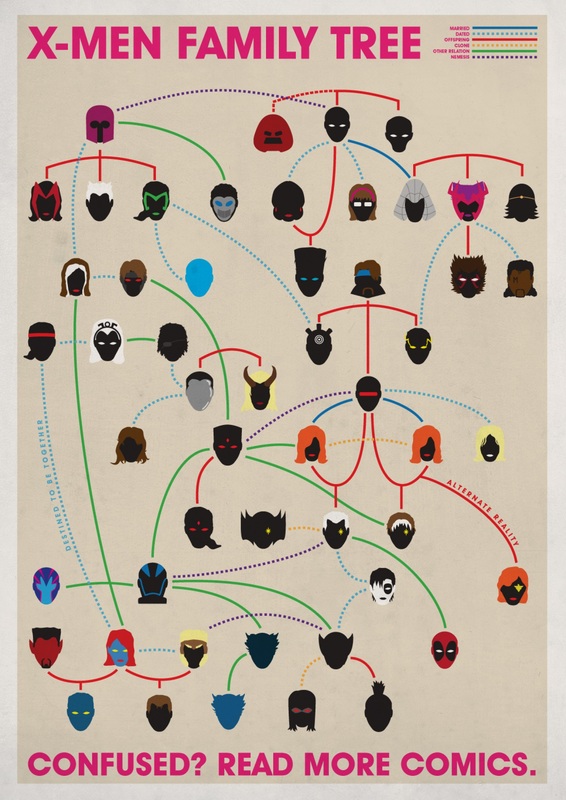
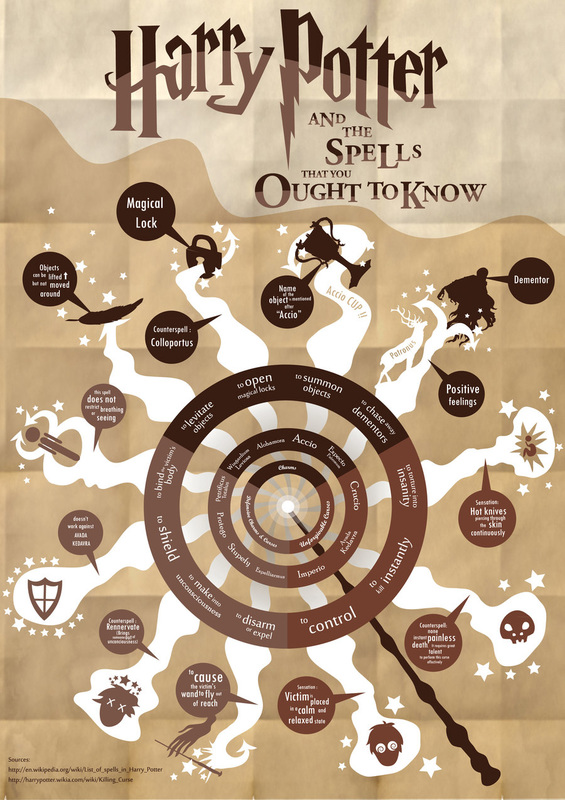
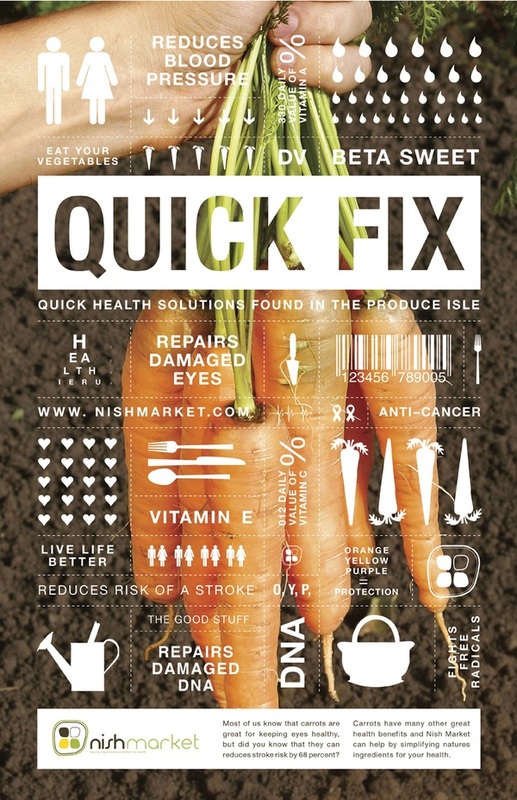
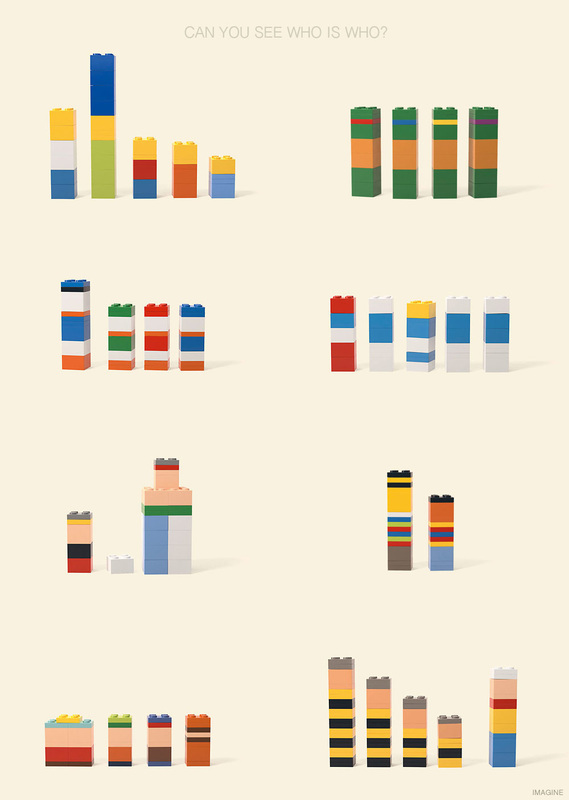
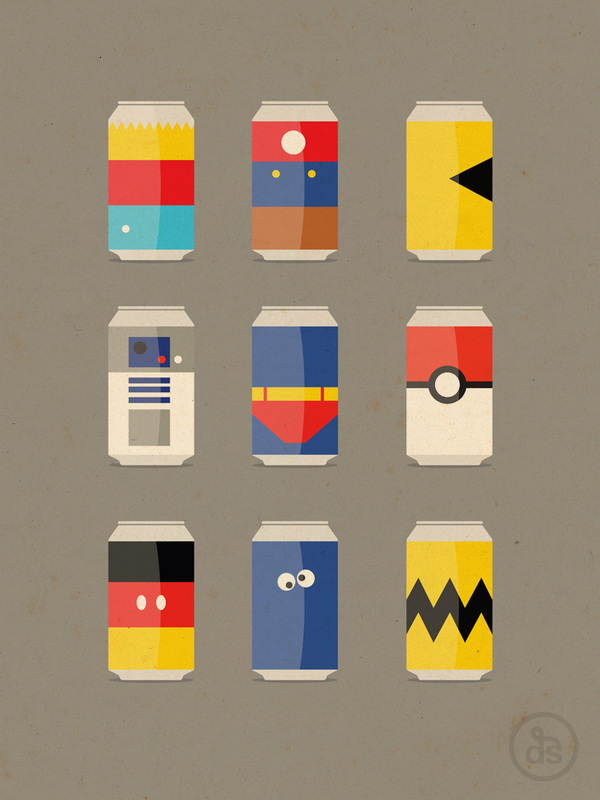
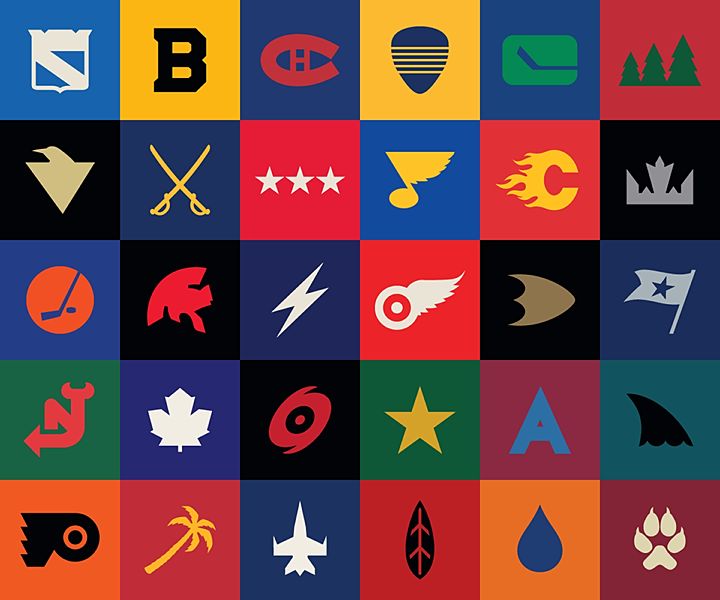
Infographic thinking" lets designers invite the viewer [to] join in the process of interpretation. It’s what makes infographic design a language, and not a formula or a fad. Information graphics or infographics are graphic visual representations of information, data or knowledge intended to present information quickly and clearly. They can improve cognition by utilizing graphics to enhance the human visual system's ability to see patterns and trends. We’ve all heard the phrase, “a picture is worth 1,000 words.” An infographic (short of information graphic) is a picture that blends data with design, storytelling, and insights that helps designers concisely communicate messages to their audiences. Info-graphics are a fun and quick way to learn about a topic without a ton of heavy reading. Your audience can quickly consume the data and easily understand it. There are different styles of info-graphics and data visualization, but the ultimate goal of an Info-graphic is to be shared. TEAM BRAINSTORMING + DATA COLLECTION
Before you can create your graphics, you need to sit down with your team and brainstorm ideas. Try and think of questions and surveys that are funny, interesting, telling of the present times, and revealing about the school’s culture. How to gather data and information: 1. Canvasing, doing one on one polling 2. Hand out poll question sheets, collect at a later time 3. Online polls. Make the questions simple enough so that your polling is more efficient. Determine a sample size that is adequate. For example if you have 1000 students in your school, maybe you determine you need 10% (100 students). Your goal is to represent the student population, so consider the data you collect and how that tells the story of your school. Choose a poll voting closing date, because you can’t wait forever for the results. ONLINE POLLS There are many websites out there that let you create and save polls like POLL DADDY. You can choose to create a website page with all the poll questions so that students can just answer them all at once. There are free website building sites out there like WEEBLY that allow you to host your PollDaddy.com questions or surveys. Your last step is to obtain the webpage address and generate a QR code (goqr.me). Make a simple poster with a giant QR code (with the website on the bottom) and a heading, “YEARBOOK POLLS- VOTE NOW”. Now start posting them up all around the school. With your smart device barcode scanner apps you can now access the poll questions at your own leisure. WAYS TO CREATE INFO-GRAPHICS
|
|


USING ILLUSTRATOR
|
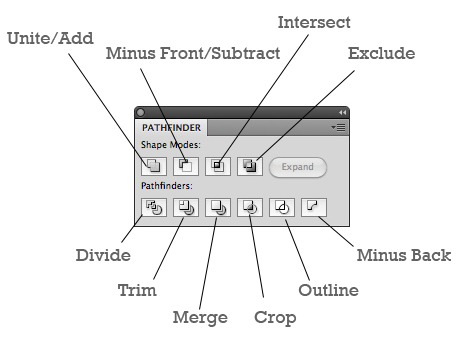
THE PATHFINDER TOOL - You can combine vector objects to create shapes in a variety of ways in Illustrator. The resulting paths or shapes differ depending on the method you use to combine the objects.
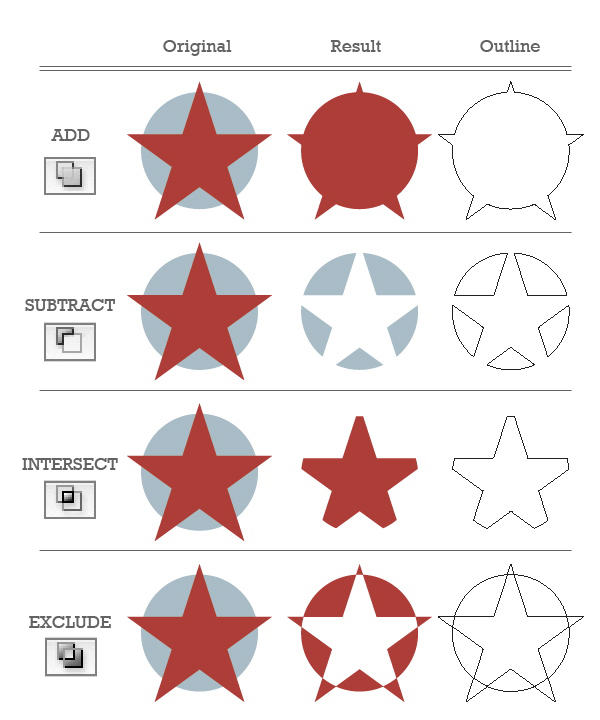
Add- Traces the outline of all objects as if they were a single, merged object. The resulting shape takes on the paint attributes of the top object. Intersect- Traces the outline of the region overlapped by all the objects. Exclude- Traces all non-overlapping areas of the objects, and makes overlapping areas transparent. Where an even number of objects overlap, the overlap becomes transparent. Where an odd number of objects overlap, the overlap becomes filled. Subtract- Subtracts the front-most objects from the back-most object. You can use this command to delete areas of an illustration by adjusting the stacking order. Minus Back- Subtracts the objects in back from the frontmost object. You can use this command to delete areas of an illustration by adjusting the stacking order. Divide- Separates a piece of artwork into its component-filled faces (a face is an area undivided by a line segment). Trim- Removes the part of a filled object that is hidden. Removes any strokes and doesn't merge objects of the same color. Merge- Removes the part of a filled object that is hidden. Removes any strokes and merges any adjoining or overlapping objects filled with the same color. Crop- Divides artwork into its component-filled faces, and then deletes all the parts of the artwork that fall outside the boundary of the topmost object. It also removes any strokes. Outline- Divides an object into its component line segments, or edges. This command is useful for preparing artwork that needs a trap for overprinting objects. |
WINDOW>PATHFINDER
|

LIVE TRACE
|
|
|
2024